#> data = read.csv('PATH_TO_YOUR_FILE/walmart.csv')
#> head(data)Statistical testing using R
Data
Load the data set into R environment. This data set is collect by Walmart for researching variables that might influence the CPI score (Consumer price index).
[DOWNLOAD HERE]
Simple plots
Making some simple plots is a smart way of knowing our data set in the first stage. Try to make all following plots. What conclusion can you make by observing?
- A side-by-side boxplot
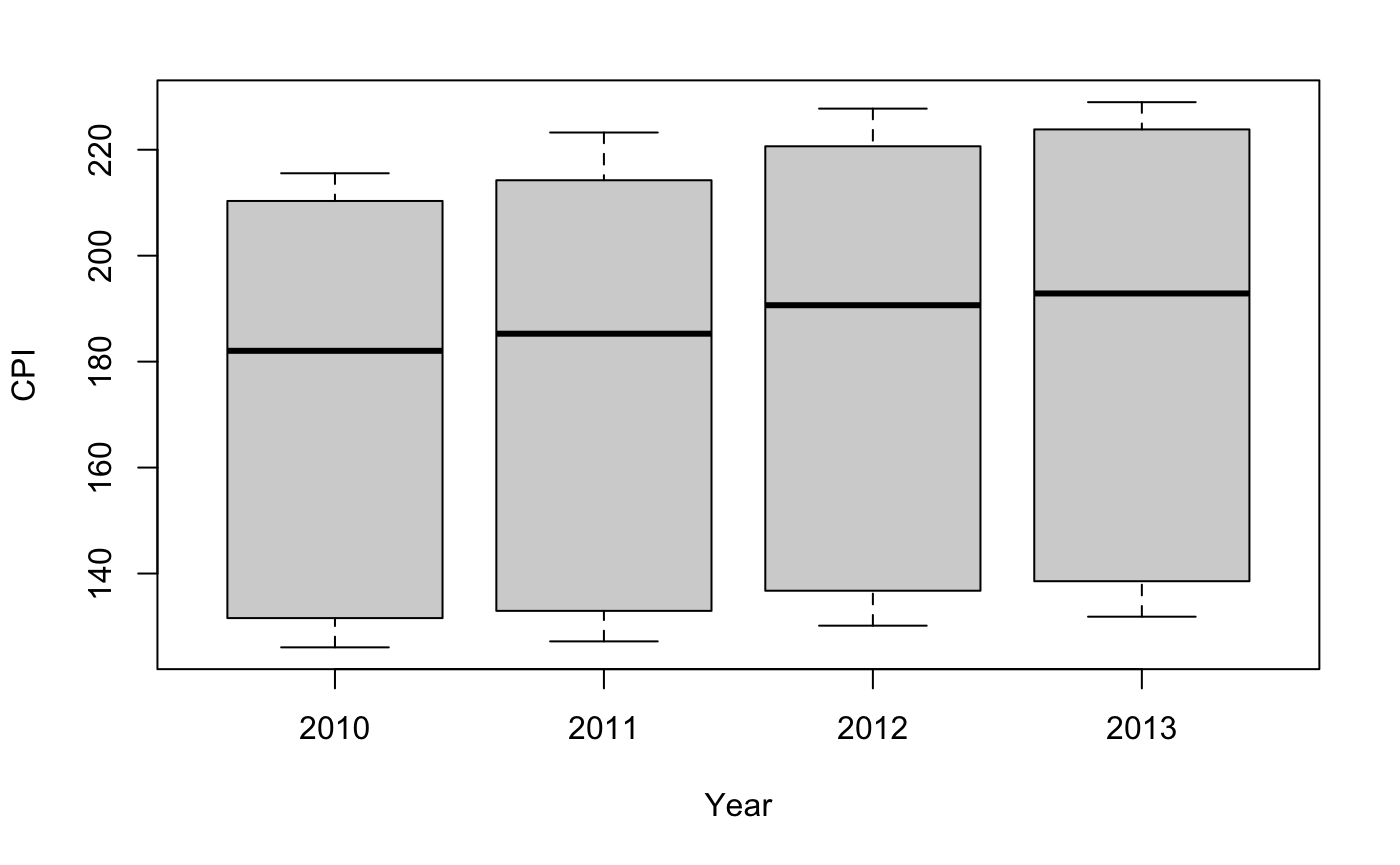
# Side-by-side boxplot.
## YOUR CODE HERE ##- A scatter plot. x: Unemployment, y: CPI
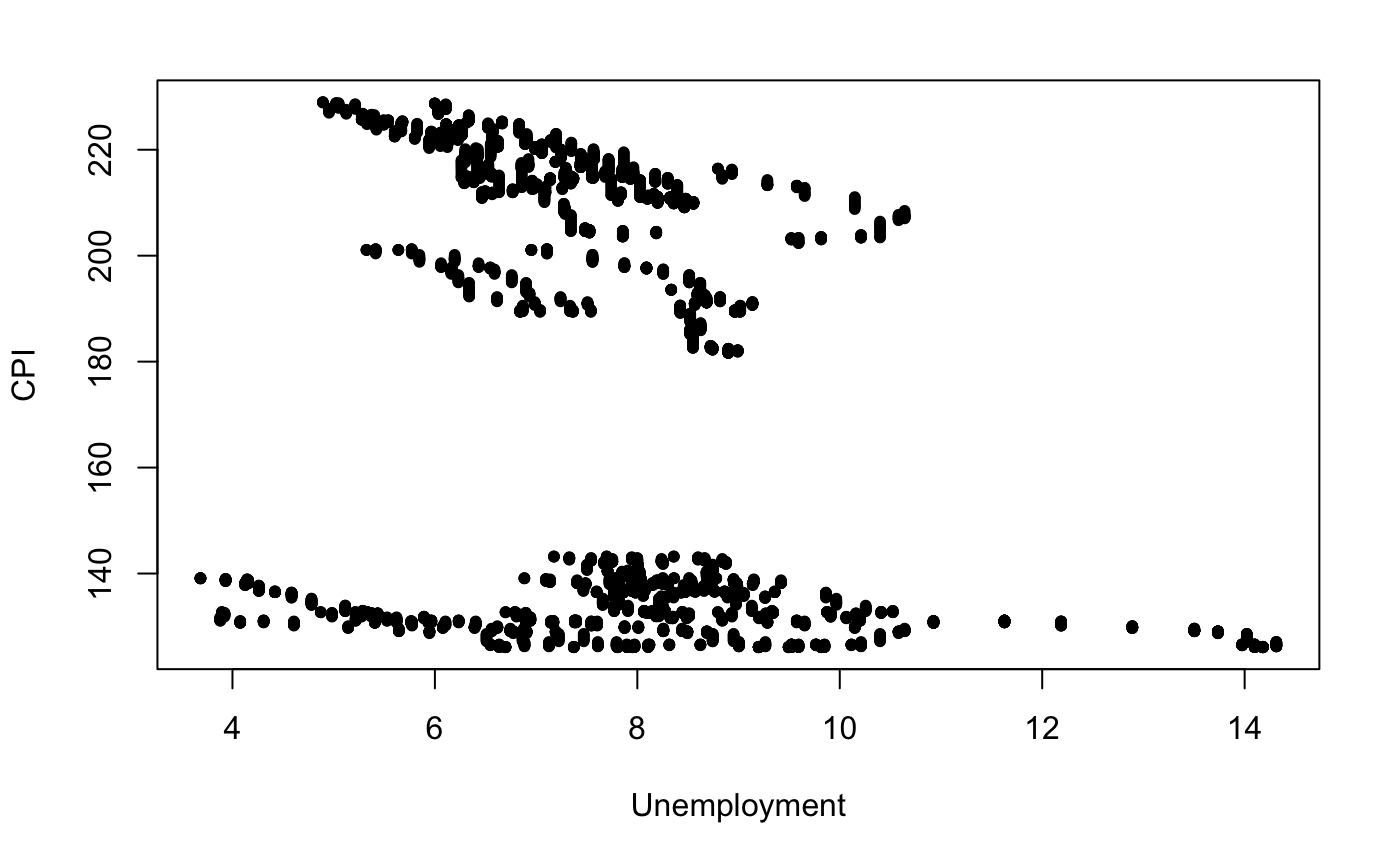
# Scatter plot.
## YOUR CODE HERE ##
Descriptive statistics
Calculate sample size, Mean SD, variance, IQR of CPI each year and present it in a table. This should be a data frame or a matrix with six columns.
# Descriptive statistics
## YOUR CODE HERE ##
t-test
- Test if the CPI score in 2010 and 2012 are the same.
- Assume that the population variances are not the same. Which t-test should you choose?
- What’s your hypothesis? (H0 vs H1)
- Driven the test in R. What is your conclusion?
## YOUR CODE HERE ##- Test if the fuel price in 2010 and 2012 are the same. Then, assume that the population variance is the same.
- Which t-test should you choose?
- What’s your hypothesis?
- Driven it in R, and what’s your conclusion?
## YOUR CODE HERE ##Correlation coefficient
Calculate the pairwise correlation between year, temperature, and fuel price. Present it in both the plot (scatter plot) and correlation matrix.
## YOUR CODE HERE ##Advanced
Try this section after you finish all previous sections
Fancy plots
- Paint scatter plot by years.
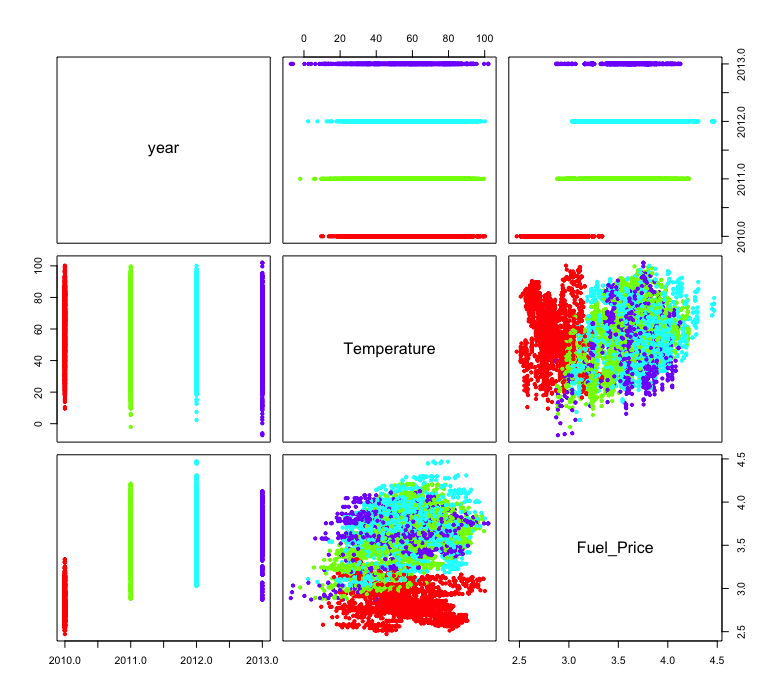
## YOUR CODE HERE ##- Add density plot, correlation coefficient score, and confidence interval. (HINT: ??pairs.panels)
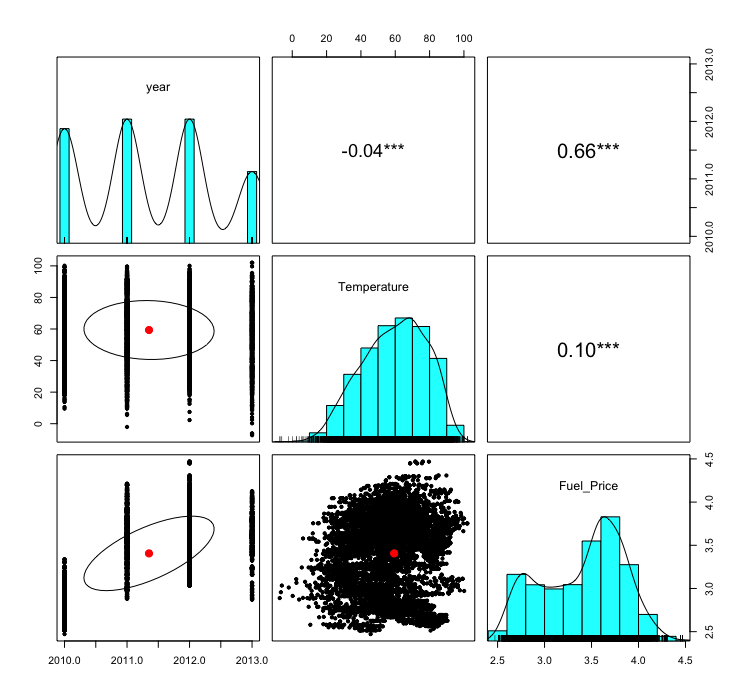
# install.packages('psych')
# library(psych)
## YOUR CODE HERE ##
The simple linear regression model
Fit a simple linear regression model with - Independent variable: CPI (x) - Dependent variable: Fuel price (y)
Answer the following questions. - What is the p-value in the returned table stand for? - What is the formula of this model?
## YOUR CODE HERE ##Draw the scatter plot and the fitted regression line.
## YOUR CODE HERE ##Draw the residuals plot. Does the variance of CPI well explain by the fuel price?
## YOUR CODE HERE ##Discrete data
This section will try to fit a linear model with independent variables having a discrete data type.
Fit store, year, temperature, fuel price, and unemployment rate into the model. Note that store and year should be considered category data in this case.
This will return a long table. When we consider category information as a dependent variable, using a dummy variable is how we calculate.
- What are the reference points for stores and years?
## YOUR CODE HERE ##Draw the residual plot again. Does CPI be explained better in this model?
## YOUR CODE HERE ##ANOVA
Fit a two-way ANOVA model: CPI = Store + year + e. - Do your degrees of freedom make sense? (If it is 1, you may forget to convert your data type as factor) - What conclusion can you make from this result?
## YOUR CODE HERE ##